
Contents
- Introduction
- Accessing Cacti - Tree view, List view
- Behind the scenes - Gathering, RRD database
- Administration - Adding new devices - Updating port names
- Installation overview - hardware - 1 minute polling - cactid - 64bits snmp - security
1. Introduction
Cacti is an open-source program for collecting, storing and presenting the results of measurements that are repeated at a regular interval, especially network performance measurements. At JIVE we use it to create graphs of the network throughput for e-VLBI experiments and observations. Recording and graphing the behaviour of the network helps us in troubleshooting any issues we find and in preserving records of its performance for publication. Our Cacti installation measures all the traffic through our central switch/router once every minute.
2. Accessing Cacti
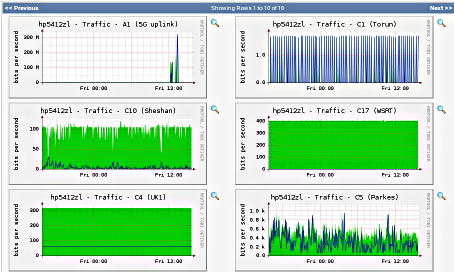
Our Cacti installation is accessible from all over the world, its URL is: http://graphs.jive.nl. When you open this page in your browser, you will see a starting page which shows the throughput of all our incoming fiber connections for the past 12 hours. The description at the top of the graph tells you the port number (e.g. 'A1', 'C17') of the connection being monitored, and a descriptive name of that connection (e.g. '5G uplink' or 'WSRT'). You can view a shorter timespan by selecting it from the 'Presets' dropdown just above the graphs - the available range is from 30 minutes to 2 years, but you can also use the calender buttons next to it to define your own range.
Each of the graphs is clickable: you will then see a number of graphs of the traffic through that particular networking port. The top graph has a resolution of about a minute and spans the past 4 hours. Subsequent graphs show a larger timespan, but at less resolution. By clicking on the little 'magnifying glass' icon next to a graph you'll be able to highlight any area of it with the mouse to zoom in on a graph.
 2.1 Tree based view
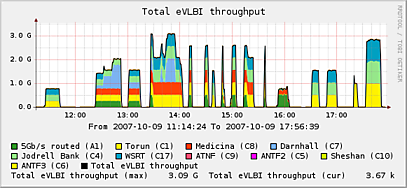
Clicking the tree-shaped icon at the top-right hand of the Cacti page brings up a list of pre-defined choices. Each of these choices corresponds to a default set of graphs to be displayed. 'All Fibers' shows all the incoming connections at JIVE, just like the default page. 'All Mark5' shows the traffic that exits the switch towards the Mark5 servers located at JIVE. Finally, 'all eVLBI input' shows a stacked graph where each colour represents one of the incoming fiber inputs on the central JIVE switch/router.
 2.2 List based view
List view is also accessed by clicking on its icon on the top righthand of the Cacti page. It brings up a complete list of available graphs. The checkboxes at the left of each entry select them for being included in the graph view. Use 'Previous' and 'Next' at the top of the page to view more entries, then use the 'View' button at the bottom to have Cacti generate one or more pages with the requested graphs. These pages will still update themselves every minute as new measurements are taken.
3. Behind the scenes
3.1 Data gathering
Our Cacti server will query the HP/ProCurve 5412zl switch/router at JIVE once every minute to gather statistics for all interfaces. By gathering the statistics on the network switch we can monitor networking performance without causing any additional CPU load for the Mark5 servers. The switch is read out by using the SNMP protocol. Specifically, we use SNMPv3 because it offers access to data in 64bits and with encrypted password access. The original SNMP version 1 does not provide much security and is not able to keep up with the high datarates in use nowadays.
3.2 Round Robin Database
The RRD subsystem stores all the measurement data on disk. It stores the same data at several levels of resolution. The best time-resolution is 1 minute between datapoints, Cacti saves about 4 days of data at this highest resolution. As more data are added, it discards the oldest data. This keeps the amount of diskspace to store the data constant and keeps the CPU performance to display it manageable. At the same time it records the same data in coarser time-increments, but for a much longer timespan. The graphs with a time resolution of a day span a full year. At any resolution, new data replaces older data while measurements continue.
4. Administration
Changing the configuration of Cacti requires a username and password. The documentation on the www.cacti.net pages is of course the best source for documentation on how to administer a Cacti system, but the most common tasks are documented below. These operations are only available to administrators.
4.1 Changing port names
Each network port on a switch/router has a fixed port number, but often also a port alias where the administator can record a descriptive name for that port. Cacti reads these items through SNMP and uses these alias entries to include in the graph title, but only when a graph is created. After changing the port alias in the switch configuration, you must also go to 'Manage Graphs' section in the Cacti Console. Put a checkbox next to the graphs that must be renamed, and select 'reapply suggested names' in the drop-down menu.
4.2 Adding graphs
To add new graphs, simply click on the 'New Graphs' under 'Create', in the console frontend. On the next page, select any interfaces you want to create graphs for. Make sure to select the 64bit SNMP counter version at the bottom righthand (e.g.: "In/Out Bits 64-bit counters") or the graph will not be able to accurately track high speed interfaces. Also make sure that Cacti knows that the correct speed of the interface: otherwise it will discard high-speed data as invalid. You can change this in the 'Data Sources' menu.
5. Installation overview
We've made a few specific tweaks to Cacti in order for it to better match our needs. These changes are documented below.
5.1 Hardware
Our Cacti runs on a dual-core 3.4GHz Pentium machine, with 1GB of memory. Storage is two 80GB discs in an LVM mirror configuration. The machine has both an interface to the eVLBI network (firewalled, in the DMZ) and to the internal network to read the SNMP values.
5.2 1 minute polling
Our Cacti does a polling run every minute, instead of the default of every 5 minutes. This has been set up as discussed in the Cacti Forum thread 3971. The RRA storage for high resolution data has also been increased to 5 days.
5.3 64 bit counters
The 32 bit counters used in SNMPv1 will not keep upu with more than about 517Mb/s of traffic when polling once a minute. SNMPv3 supports 64 bits counters and security, and all graphs data sources have been switched to 64 bits.
5.4 Cactid
Because of the 1 minute interval polling, the polling is done from the stand-alone cactid, not the PHP poller built into Cacti.
5.5 Favicon
Included a /cacti/cacti.ico as per Cact Forum thread 18364.